Based upon our experience working with thousands of crowdfunding campaigns on Kickstarter and/or Indiegogo, here are some basic tips for using Google Analytics effectively in marketing your crowdfunding campaign…
As we stated in our previous blog entry, if you want to multiply pledges to your crowdfunding campaign, then crowdfunding marketing is a powerful tool, but not if you promote your project blindly. Budgeting money based upon mere speculation is reckless, and it can be terribly wasteful—plus, it’s entirely needless as long as you have excellent tools available to measure the performance of your marketing efforts.
One of the most powerful tools currently available for analyzing digital marketing is Google Analytics. And, thankfully, both Kickstarter and Indiegogo allow campaigners to use Google Analytics for their respective campaign pages. We spent our previous blog entry detailing how to set up a Google Analytics account for a crowdfunding campaign, and we’ll spend this blog entry explaining how to use it effectively in crowdfunding marketing.
Campaign marketing involves targeting different audiences with messages that will hopefully draw them to your crowdfunding campaign page. After they’ve arrived, the members of each audience will show different average conversion rates and other statistics, which are helpful to measure to determine the relative profitability of each audience. You can’t analyze these rates very effectively unless Google Analytics can clearly differentiate between the different audiences that you’re targeting, and Google Analytics won’t do this well for social media—for example, by default, it will display all Facebook traffic as originating from facebook.com, whether that traffic resulted from ads or posts or comments, which is terrible for Facebook advertisers. There are two notable methods that help Google Analytics to clearly differentiate between different social-media advertising (or posting) audiences, which are redirects and parameters, and we’ll now examine each of those two methods in turn.
Redirects involve sending your post/ad traffic to an intermediary webpage that will automatically forward its visitors immediately to your crowdfunding campaign page, in which case Google Analytics will treat those visitors as having originated from the intermediary website rather than from the original website. By assigning a unique intermediary URL to each audience that you target, you can easily distinguish each audience’s members within Google Analytics. We use this technique on our fnd.to website, which maintains a unique landing page for each crowdfunding project, and will instantly forward any visitors to the appropriate campaign page. As we market each campaign, we draw clickers to its respective fnd.to landing page, but we use a different subdomain for each audience that we target; for example, if we were marketing a project named Bob, then one of our Facebook ad sets may send its clickers to 52dsa.fnd.to/bob, our MTKP profile on Twitter may share a post that draws clickers to mtkp.pta.fnd.to/bob, and a specific member our Cashback Network may use 3210n.fnd.to/bob for affiliate marketing. You may achieve similar results by using a URL-shortener site like Bitly but, considering how such traffic can affect website rankings, it might be better to use a special landing page on your company website. Along with coding this landing page to forward its visitors properly, you should also code it to look attractive on social media if you plan to use it to track social-media posts.
Parameters can achieve the same results as redirects without your needing to actually create any intermediary webpages. This technique involves sending clickers directly to the URL of your crowdfunding campaign page, but appending that URL with some extra data in the form of a question mark followed by a series of settings connected by ampersands. This extra information won’t normally affect anything that your clickers can see, but it’ll affect your analytics if it’s formatted properly, overriding the default source with a source of your choosing. Kickstarter’s backend responds to a ref tag, while Google Analytics uses a set of tracking parameters (including both utm_medium and utm_source), each of which you can set to the appropriate values. So, for example, if you post your campaign page on Facebook, then you might want to append its URL with ?ref=fb-posts&utm_source=1fp.mysite.com so that anyone who clicks on those ads will be treated by Google Analytics as if they arrived at your campaign page from 1fp.mysite.com (even if this site doesn’t exist) rather than facebook.com—and, if they pledge, then Kickstarter will display the pledge’s source as fb-posts rather than facebook.com. Or you might configure one of your Facebook ad sets to include the parameters ref=fb-ads&utm_source=321fa.mysite.com for the same purpose. When adding such parameters to any of your Google Ads, you’ll need to configure the appropriate Google Analytics property’s Property Settings so that your customized manual tags will override Google Ads’ standard automatic tags, as instructed in our previous blog entry.
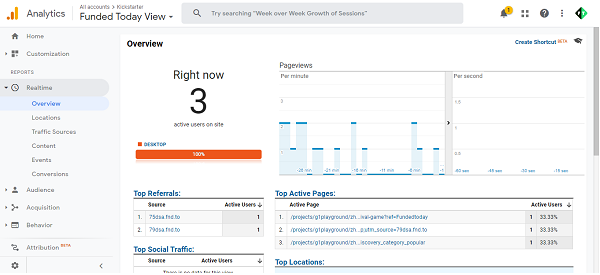
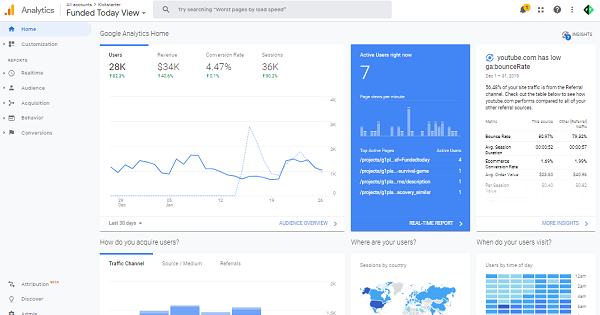
As visitors arrive at your campaign page, regardless of their source, you can watch them in Google Analytics’ Realtime menu, which can be a rather addictive pastime for some. But the Google Analytics menus that will probably help you most are its Acquisition menu, its Conversions menu, and its Audience menu, which we’ll now overview one-by-one.
Google Analytics’ Acquisition menu helps marketers to better understand the sources of traffic to their website, plus how different streams of traffic behave after they’ve arrived.
The Acquisition submenu that will probably interest you most is Acquisition > All Traffic > Source/Medium, which shows a table of sources (plus what type of sources they are) for all of your webpage’s visitors. If it doesn’t already list every source, then you may use a pull-down menu in the lower-right corner to display additional rows of data. This table (by default) normally displays data for 30 days until yesterday, which may be fine for e-commerce but it isn’t quite as relevant for crowdfunding. You can adjust this time-frame through another more-complex pull-down menu near the upper-right corner, although you can never select time-periods smaller than a single day.
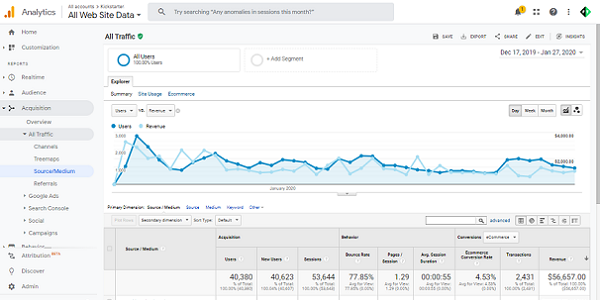
This Source/Medium table’s list of sources should include some standard sources for all campaign pages. One standard source is “direct / none,” which is a broad catch-all category that includes not only people who visit your webpage by typing in its address character-by-character (or by copying-and-pasting it) into their Internet browser, but also those who select that address either from their browser’s bookmarks or from its list of previously-visited webpages, as well as those who visit your webpage from any other source that GA can’t easily identify (which includes other pages on Kickstarter). Another standard source is “google / organic,” and perhaps some other “organic” entries, which represent those visitors who find their way to your webpage through various Internet search engines. Many sources are normally labeled as “referral,” which indicate visitors who arrived at your campaign webpage by clicking on a link found on another webpage, which normally includes social-media posts and/or ads. If you’ve used those tracking techniques detailed above, then you should see each of your marketing sources listed separately in this column as referrals. Atop this table, you may use its tiny search bar to limit this list to only those sources that interest you.
Google Analytics sorts this Source/Medium table according to Sessions (total number of webpage visitors from/through that source) by default, but you may re-sort this table in other ways, instead, by clicking its appropriate column. You might notice a column for Bounce Rates, which are normally very high for crowdfunding campaign pages, since their visitors normally “bounce” elsewhere without visiting any sub-pages unless they’re interested in pledging. Due to these high “bounce” rates, all GA data about time spent viewing your page may be inaccurate, as this Misunderstood Metrics article reports. The two columns that will probably interest you most are both Ecommerce Conversion Rate (pledgers/visitors) and Revenue (total dollars pledged). If you don’t see either of these columns, then you haven’t enabled your view’s Ecommerce Settings, in which case you’re welcome to consult our previous blog entry about setting up Google Analytics properly for crowdfunding campaigns before continuing.
Conversion rates normally vary considerably; rates of 1% aren’t uncommon, and rates of 10% are wonderful. These rates depend upon a variety of factors, which include an inverse relationship with average pledge size. This relationship is one reason why conversion rates are less useful for comparing campaigns than per-session value (which is also known as earnings per visitor). You can view per-session value by looking above the blue line chart at the Explorer tab and, underneath it, clicking Ecommerce instead of Summary, which will cause a different set of columns to appear in your Source/Medium table. For whatever it may be worth, we’ve noticed that our successful partnerships normally enjoy EPVs of at least $1 for our ad referrals and about $4-5 for “direct” traffic. Whenever your direct traffic is enjoying relatively-high EPVs but your ads are enduring unusually-low EPVs, this discrepancy probably means that you need to target your ads better—but, if both of these two EPV rates remain terribly low, then this fact suggests that you’ve got a problem with your campaign media or even with your core offer.
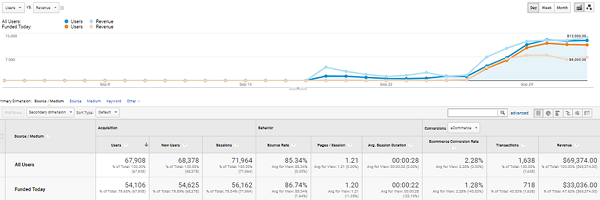
This Source/Medium table’s line chart is also useful in showing your campaign’s daily progress. It normally shows only webpage-visitors per day, but you can use its second pull-down menu—the one that (by default) reads “Select a metric”—to select Ecommerce > Revenue so it will display dollars-pledged per day, as well. You can use these same two menus to display various other sorts of data over time, as well, but both Sessions and Revenue will likely interest you most. Along with these basic variables, you can configure this line chart to display various “segments” of your total data, such as only those visitors and/or pledges that were referred by your advertisements. You may create new segments by looking near the top of your page, clicking the Add Segment button, clicking the red New Segment button, clicking the Traffic Sources tab, specifying Filter Users, designating something like “Source ends with a.mysite.com,” naming this segment, and clicking the blue Save button. After you’ve created one or more segments, you may display them by clicking the Add Segment button again, clicking checkboxes of the segments that you want to display, and clicking the blue Apply button. Segments can be useful for comparing how your different marketing techniques are performing over time.
Google Analytics’ Conversions menu isn’t as useful as some others, but it includes one submenu that we’ve sometimes found rather interesting, which is Multi-Channel Funnels > Model Comparison Tool. This tool enables you to see how your data would shift if you adjusted the rules that Google Analytics uses to assign responsibility for each sale (or pledges in this case) to a given source of traffic. Google Analytics (by default) attributes pledges to the source from which visitors arrived immediately before they pledged, but such last-click attribution isn’t always appropriate. For example, an advertisement may start a social-media user on a long-term journey to visit your campaign page, peruse your project, leave, and eventually return on another occasion to pledge, in which case Google Analytics will (by default) attribute responsibility for their pledge to the pledger’s return source (which may be a browser bookmark or an Internet search) rather than to the original ad that they saw—which is arguably the wrong way to attribute it. But Google Analytics’ Model Comparison Tool enables us to test other models, such as first-click attribution. This tool has shown us that, for every 100 ad-clickers who pledge to a campaign during their first visit, 15-50 (or more) may pledge to that same campaign during a return visit. As best as I can tell, those delayed pledges are typically lower for “impulse buys” and higher for costlier products. Such data may be important in understanding the full effects of your marketing efforts.
Google Analytics’ Audience submenus enable you to segment your data according to various characteristics (like gender and age-range and location and interests) so that you can see what sort of people are pledging most readily to your project, which can help you to improve how you customize your media and/or target your marketing.
This will only work if you’ve sufficiently enabled the relevant Google Analytics property to collect demographic and/or interest data—so, if you haven’t already done this, then you’re welcome to consult our previous blog entry about setting up Google Analytics properly for crowdfunding campaigns before continuing. Even after you’ve enabled these features, Google Analytics will need some time to collect enough data for it to become useful to you—statistical rates are unreliable with only one pledge but, the more pledge data you obtain, the more reliable those rates become. Also, even as pledges increase, Google Analytics won’t know every pledger’s demographic information, but it will still know enough to eventually help you to make sound data-driven decisions.
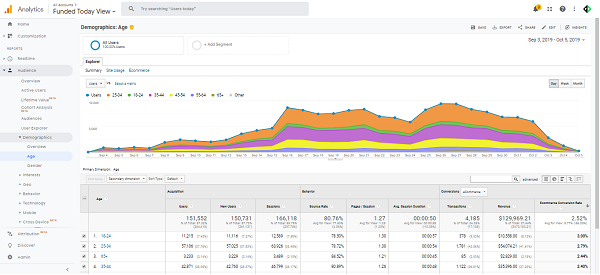
The Audience submenus that will probably interest you most are Demographics > Gender, Demographics > Age, Geo > Location, and everything in Interests. As with your Source/Medium table, you can sort these interests tables according to column, and the columns that will likely interest you most are both Revenue and (especially) Ecommerce Conversion Rate. Any lines with fewer than several pledges should usually be ignored as statistically insignificant, but the rest can help you to see which sort of demographics are most profitable to target. As real-life examples of what this data can potentially do for you… Such data once showed us that a male-targeted VPN device was surprisingly converting women better. Or that some heated gloves were converting steadily better with increasing age, and were proving wildly popular among the elderly, despite the fact that most Kickstarter users are younger. Or that some colorful shoelaces were enjoying unforseen popularity in tropical countries. Or that some backpacks for businesspeople were proving unexpectedly popular among college students. By the way, please note that your location data will usually severely overrepresent Virginia’s Ashburn area, which we believe is because an Ashburn company hosts Kickstarter’s Internet servers.
Google Analytics is arguably the most powerful analytical tool available to crowdfunding campaigners, but it’s not the only such tool, and it can help to use those other tools in conjunction with it. On Indiegogo, Facebook pixels are excellent for conveniently analyzing Facebook ad performance without needing to consult other sources, especially if you lack analytical software like ours that synthesizes data drawn from multiple sources. For Kickstarter campaigners, Kickstarter provides its own backend analytics that yield some additional insights about video plays and rewards popularity and such, BiggerCake displays some additional statistics that are also worth considering, and Kicktraq is exceptionally useful in making funding projections. Please note that, if you’re using any of these other forms of analytics, then their data won’t necessarily agree precisely with what you observe in Google Analytics, although these discrepancies are usually rather minor.
If you’d like more-thorough training in these matters, then you’re welcome to enroll in some free online courses at Google Analytics Academy. Also, please study our previous blog entry to learn how to set up Google Analytics properly for analyzing your crowdfunding marketing!